Not the lack of PPE which is not secret but we are woefully underestimating cases and probably deaths.
It hides in plain sight in the graphs.
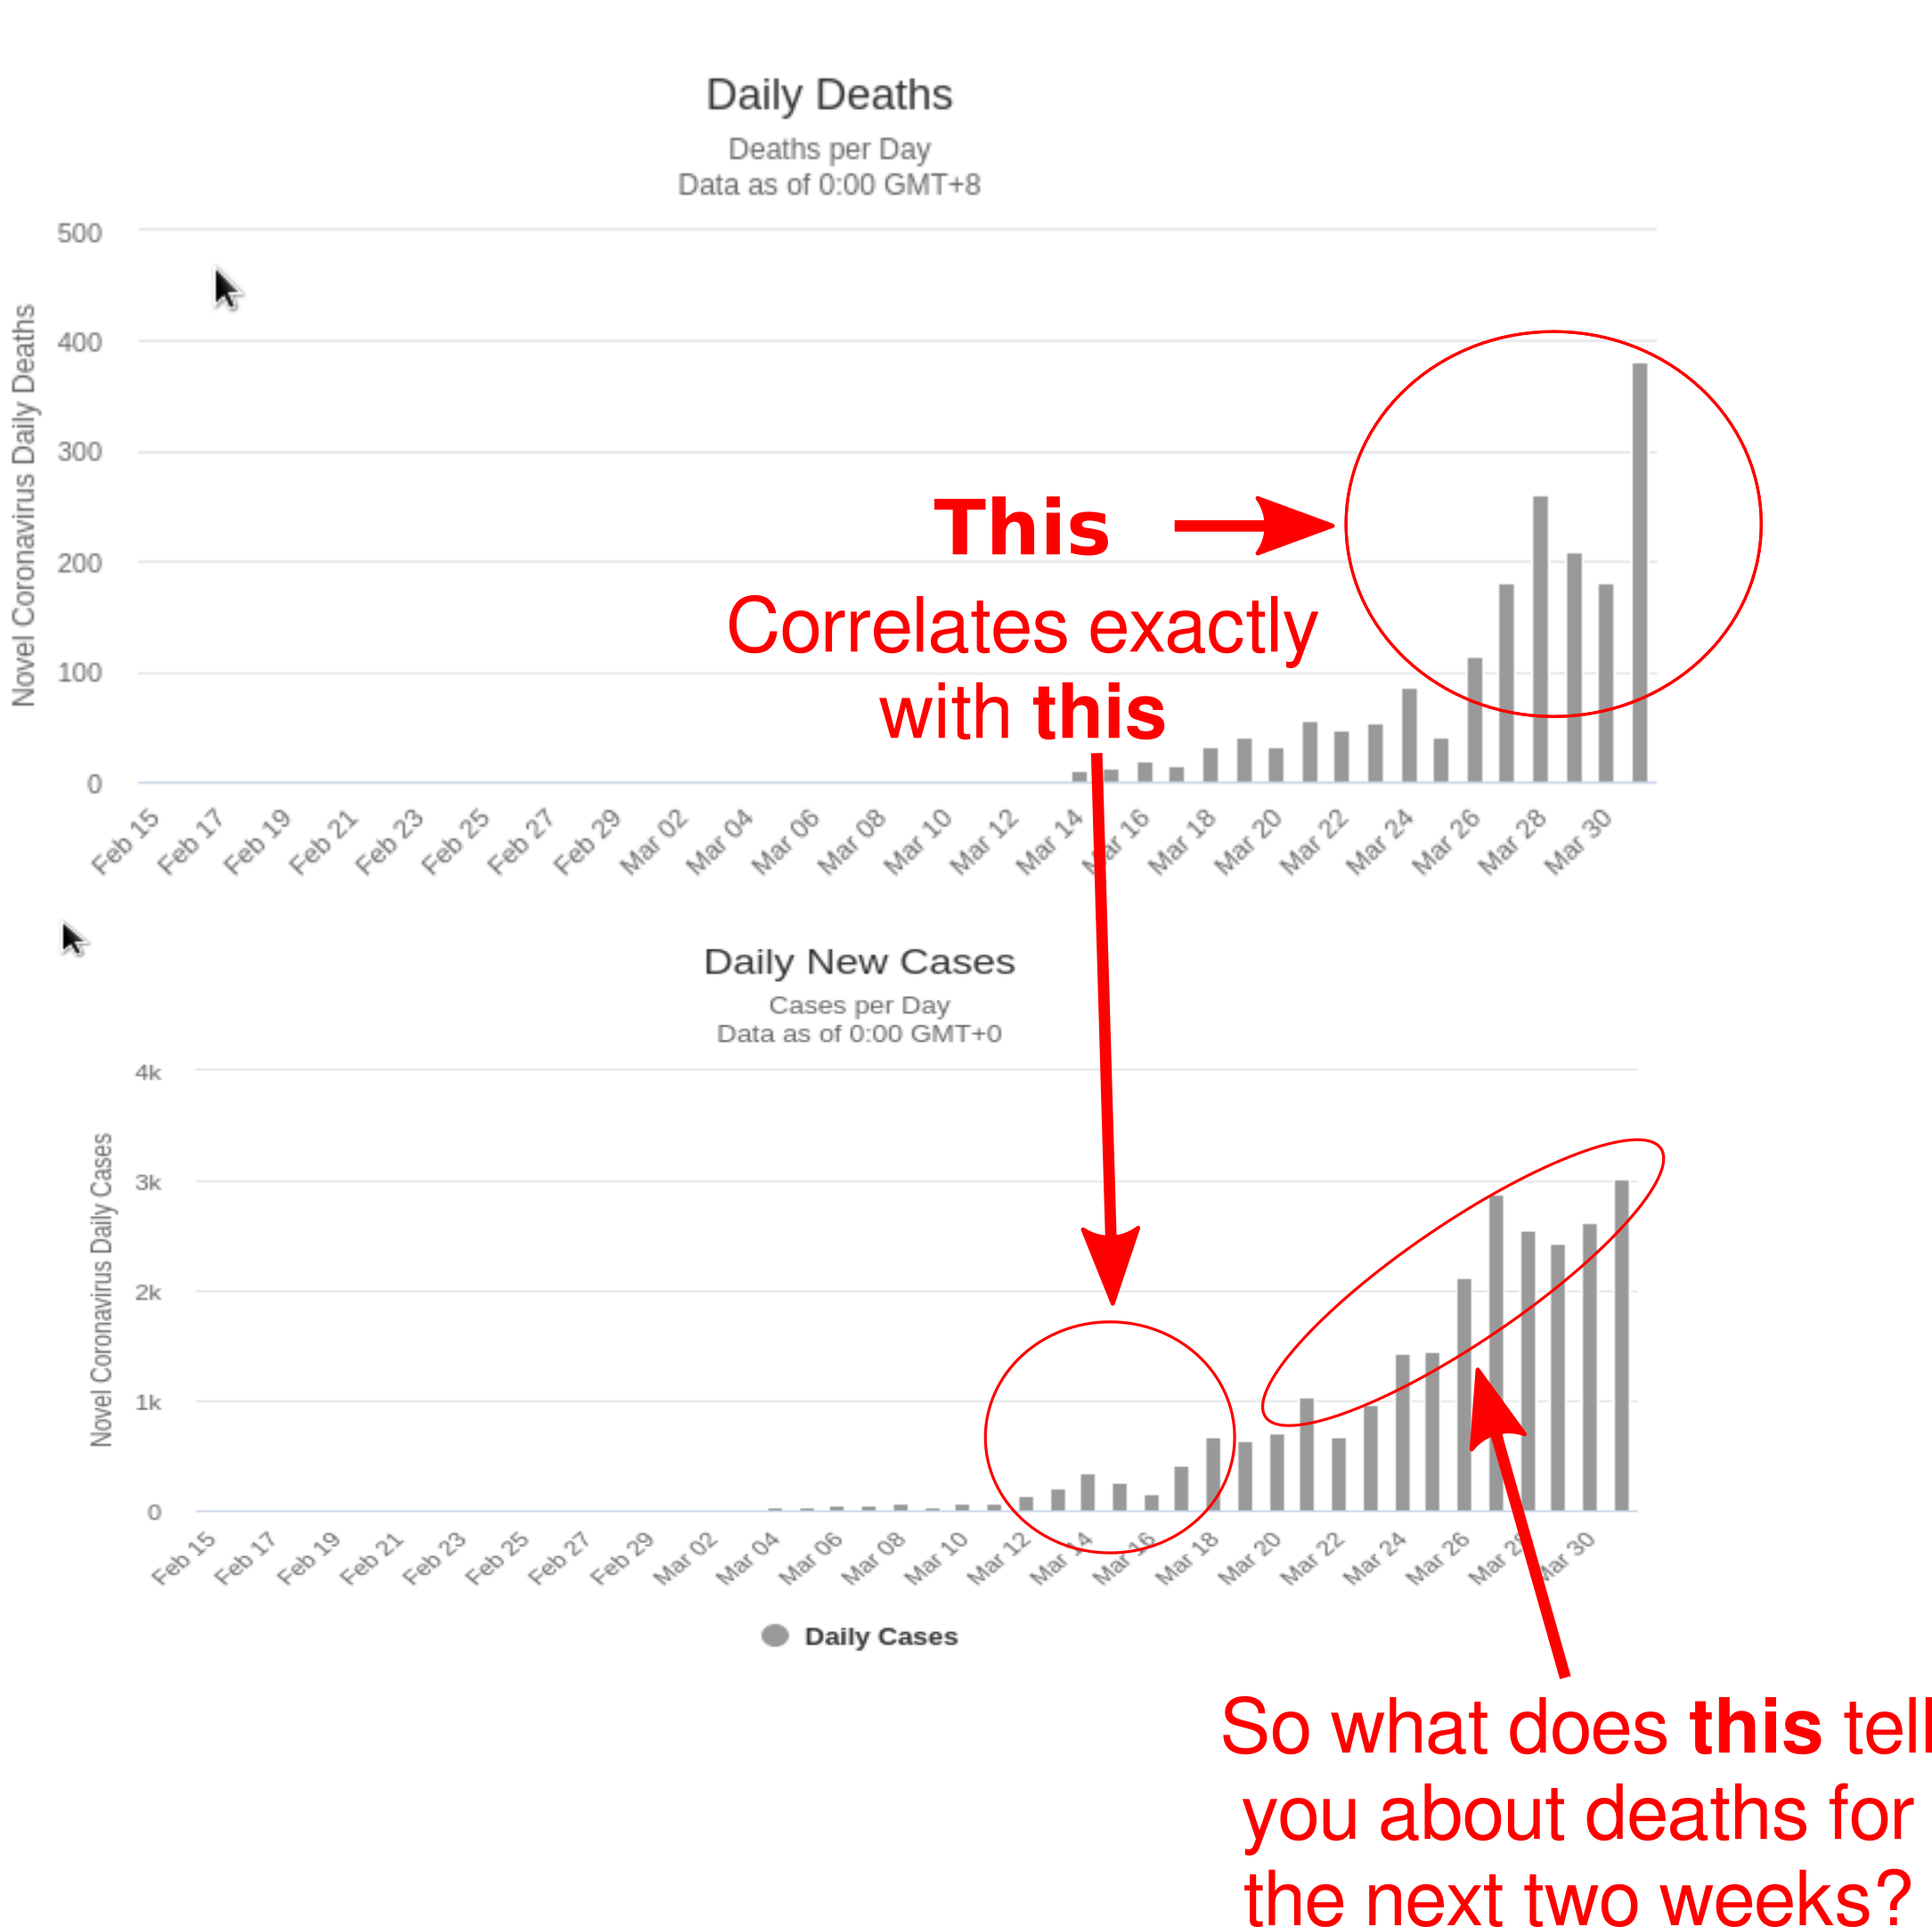
There is a nice correlation in the shape of the graph for deaths in the past few days and the new cases about 14 days ago. This is “about right” based on the Chinese data (18 days symptom onset to death) but the apparent mortality is huge - 50% or more. That fits with the local hospital which has had about 50:50 discharges:deaths.
That is way more than the case fatality seen in China which implies we are doing much less testing given that we’re only doing it on people ill enough to be admitted to hospital, we’re not testing mild cases, we’re not even testing more severe cases if they are at home - sadly this means some are going to die at home and never get tested, so never show up in the figures.
If we assume the same symptomatic case fatality rate that China reported (about 3%) we’re only picking up about 6% of cases so the true number might be 16x higher - 676 cases March 18 was probably at least 10k, new cases double every 3-5 days depending on where you calculate it on the graph - 4 doublings since then = 160k cases per day now and about 750k total cases in reality.
29k cases and 2.3k deaths does not look so frightening, but the ratio only looks good because the exponential growth means that 26 of the 29k cases have been in the last 14 days - and they are not going to be showing up in the death figures yet.