There have been reported cases of this happening in South Korea -
There have been reports on and off since the beginning - not clear whether they are reinfections, reactivations or false negatives on the test which “cleared” them - but it makes the point fairly forcably that it is not as simple as having the infection grants immunity.
Update on the graph with today’s numbers and the key-worker figures back to March 25 included. These will, of course reduce the mortality ratio as they are being tested when mildly symptomatic.

@anon88169868 You seem to be missing a vital variable in your analysis - of those testing positive - How many of them are called “Kenny”! As always the devil is in the detail!
How thick or selfish does one have to be to not take notice of the restrictions, whether that be in the UK, France or anywhere else?
1 Like
Well - using this handy tool to drill down in the ONS baby name database it seems that approximately 0.006% of babies (around 40-60 per year) are called “Kenny”.
So, on that basis, of the 78991 people who are officially positive about 5 of them should be called Kenny along with a roughly equal number of Kenneths (remembering that Sir Ken’s given name was Kenneth and not Kenny) making a total of about 10.
1 Like
IMO it’s not a case of being thick or selfish, its the subliminal message received by the brain that it’s heard the message before so switches off (bit like being nagged by the wife ![]() ) but when the message changes, people tend to listen more attentively.
) but when the message changes, people tend to listen more attentively.
Now that is proper analysis establishing the number of Kennys infected - very useful!
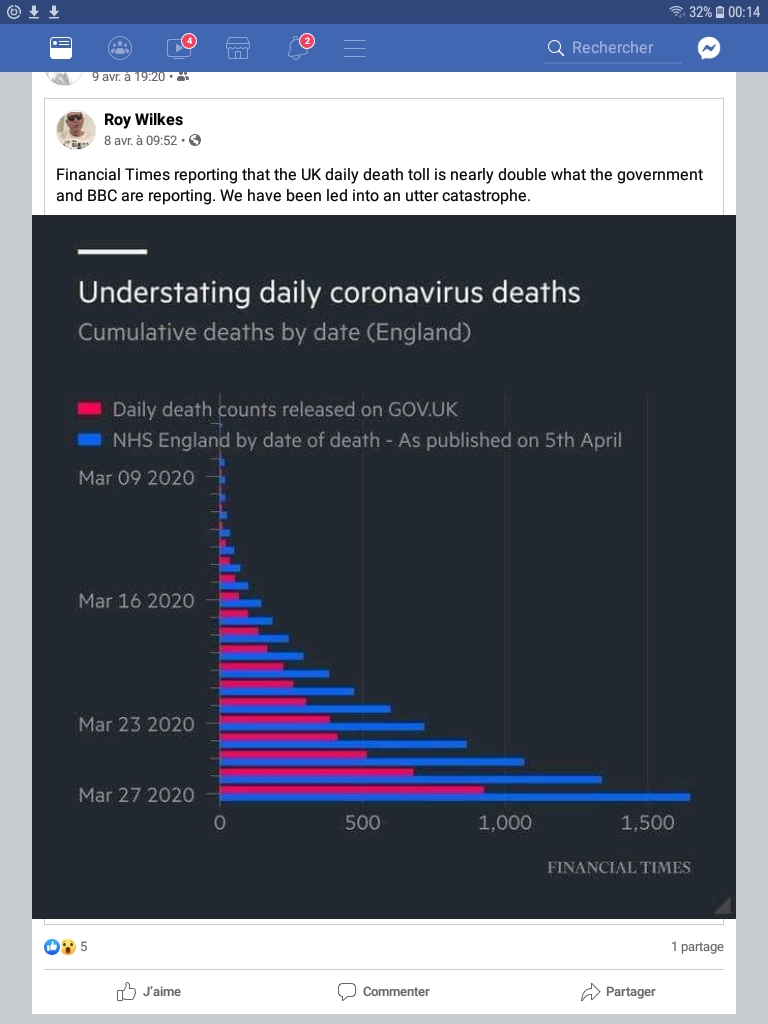
Quite scary, if its true.
It’s been obvious that the daily figures are under-reporting for some time - I’d have included the NHSE figures but they only apply to England, not the UK and they lag by 10-11 days.
Being fair to the uk.gov team they are trying to produce some numbers daily to reflect a very fast moving situation and our reporting systems are not geared up to get the data from hospitals scattered around the country to central government for collation - and hospital data is “easy” compared with data from the community.
The NHSE data is not very good for following trends because it is not as up-to-date.
I am not sure what you can do about it - other than hope (as I said above) that the govenment day-to-day data is at least consistently inaccurate and keeping in miind that it could represent as few as half the deaths and probably only 8-10% of actual cases.
There’s a good comparison of the UK vs Irish approach to Covid here
2 Likes
That thread by Lainey Doyle really is an eye opener. It throws into stark relief how badly the British media has failed its population yet again.
3 Likes
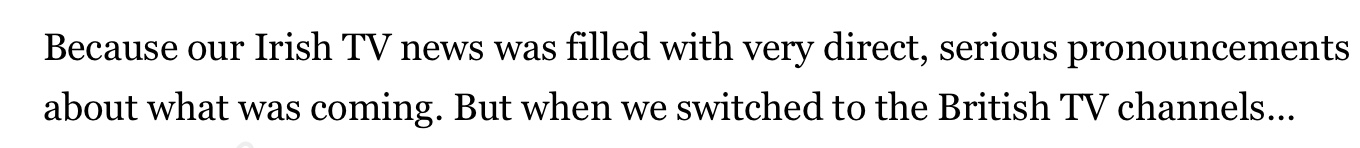
This is exactly what I thought about the difference between Macron’s and Johnson’s messages. Macron was direct and serious, Johnson was not. The pubs will be open but don’t use them, we would rather you didn’t visit beauty spots… The knock on effect of that is still happening in many parts of the UK. Late last week I watched a live Facebook questions and answers broadcast by a West Country Tory MP. His answer to the first two questions that were asked, one being the number of people exercising on Newquay’s beaches and the second about holidaymakers coming down for the Easter weekend were basically the same, there’s not much we can do about it. At a time when strong leadership is required the not so strong leader is still bending to the popular vote.
2 Likes
Bit of an update on the French graph
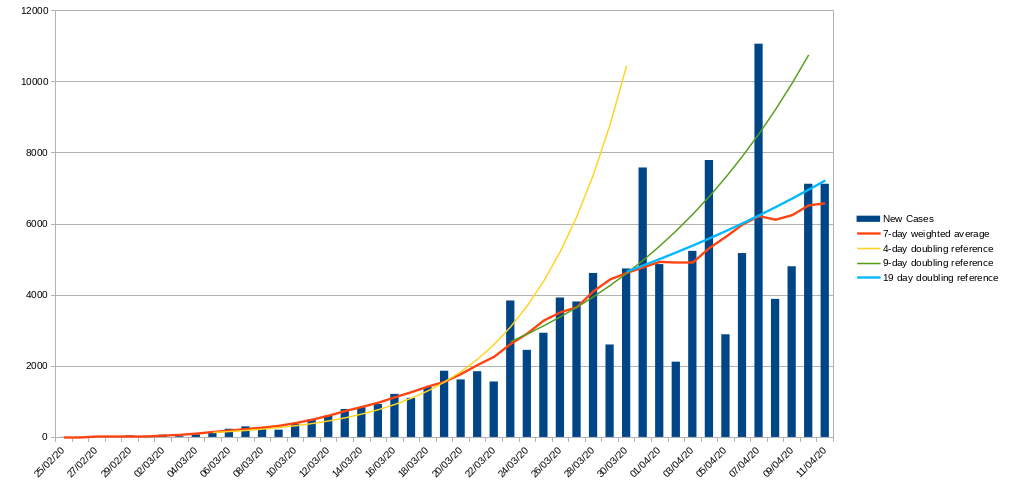
Changes from the last graph
- April 11 figures (from Worldometer) added
- averaging changed to 7 day window (± 3 days) with slightly more relative weight to the ± 1 day samples.
- new 19 day doubling reference line added starting 30.3.20
The usual caveats about data quality apply but there seems to be an interesting tri-phasic thing going on in the French data.
Initially new case numbers were taking about 4 days to double, then started to fall away from that about the 22nd of March - 5 days after lockdown - at this point tracking the 9-days to double curve quite closely. But there is a second step-down in doubling rates around the 29th/30th of March which was, again, about 5 days after the tightened measures were announced. 5 days is significant because it is thought the average incubation period is 5.6 days.
Possibly I could be guilty of over-analysis or even masaging the figures to fit a hypothesis but I don’t think so - at least not consciously.
We need to keep it going though and there are signs in both countries that resolve is weakening but we’re still only at the point that the rate of increase is slowing - new case numbers are not yet in decline and I think that they need to be before we even think of lifting restrictions.
EDIT: Oops, theres an error in this graph, accidentally copied the data from the last but one point to the last point - it should have been much lower but I’m going to wait for the “bank holiday weekend” effect to wash out before posting an update.
1 Like
Neither do I - if only all the analysis I read were as conscientious and perceptive as yours Paul!
2 Likes
If anything 5 days from intervention to change in the graph is too soon but it depends on when you test.
In the UK we’re testing when people go into hospital - so typically about 7 days after symptoms begin and the early tests could take 3-5 days to come back so you are looking at 14-17 days infection to positive result. The fact that we started to fall away from exponential growth 5-days after lockdown might have been due to earlier advice to the elderly to isolate themselves for instance.
In fact there is a 2nd turn down in the UK data about 2nd/3rd of April - it could that was the point (along with the kick down at the end of March in France) that we were really seeing the lockdown impact on the numbers.
What I find somewhat troubling is that we’re coming to end of our fourth week of confinement here yet there doesn’t seem to be any real sign that the measures have worked as they should have, we are now being told that the restrictions will continue for another month at least and I think that if this still doesn’t lead to a big fall in new cases the general public will lose faith in what the government is trying to do.
I think Tim’s post illustrates the problem - there is evidence that new cases are significantly down on where they would be had exponential growth continued but people need to see that it is working otherwise they are just going to get fed up with the restrictions.
Instead, certainly in the UK, focus seems to be on deaths - I can see why that is the case but it is going to take a lot longer - at least 2 weeks longer - for the impact of lockdown to start showing through on the number of fatalities.
I thought that the signs showed that the strategy was working. What were you expecting?
I have no doubt confinement is the right approach but I was hoping the effect would have been more marked by now.
It’s actually pretty marked - had the new case rate continued to double every 4 days yesterday would have seen 83,000 new cases in France - not 4785
This is the flip side of people just not understanding how exponential increases work.
1 Like